By Harris, Technical Staff, SHUNFU METAL
There is one variable you can never measure directly on a laser-quench line: the surface temperature during the beam pass. It rises and collapses in fractions of a second, and a thermocouple or hardness tester sees only the aftermath. The 2021 study by Liang Chenfan et al. (Transactions of Materials and Heat Treatment, 42(6):147–156) on 4145H drilling tool steel takes the opposite route: it builds an ANSYS transient thermal model of the quench, predicts the surface temperature field for every parameter combination, and uses that invisible field to explain exactly why each microstructure forms. The argument of this article: simulation-first process design is not academic luxury — it is the only practical way to find and defend the laser-quench window for drill tools.
4145H and Its International Grade Family
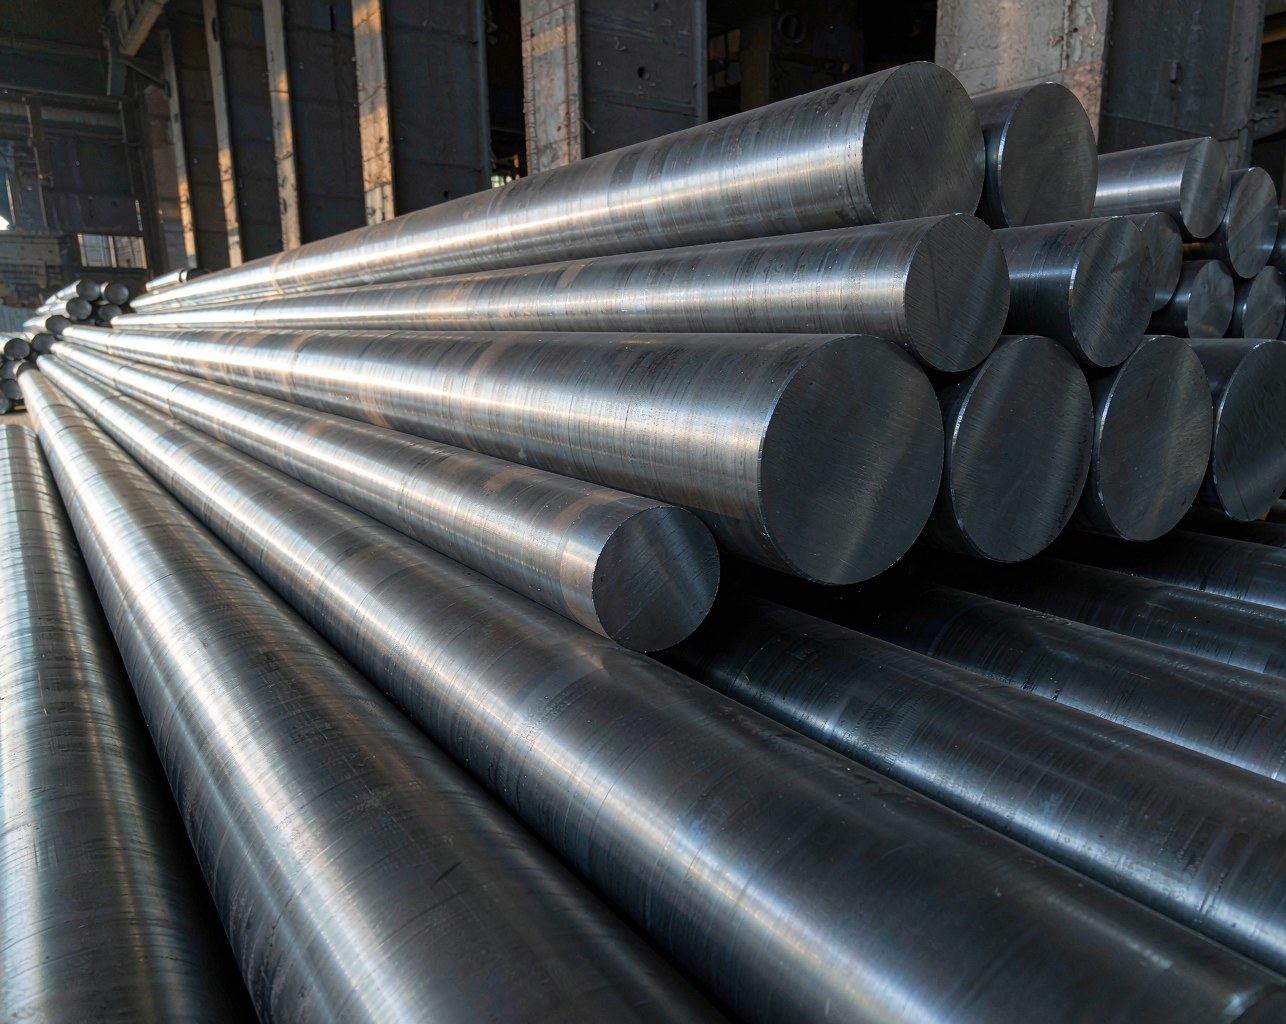
4145H is the AISI chromium-molybdenum H-steel of the oilfield, registered as UNS G41450 and supplied to ASTM A29/A304, with a guaranteed hardenability band that made it the designated material for drill collars and heavy-weight drill pipe in API Specification 7-1. In China it is produced for the petroleum drill-collar standard SY/T 5144, and buyers routinely cross-reference the domestic GB/T 3077 substitute 42CrMo. The nearest EN counterpart is 42CrMo4 (W.Nr. 1.7225), the same family appearing as JIS SCM440 in Japan; because 42CrMo4 carries less carbon (0.38–0.45% versus 0.42–0.49%), its thermal window differs, and blind parameter transfer between grades is a classic failure. The study tested a drill-collar-tightened 4145H with C 0.43–0.47, Si 0.20–0.30, Mn 1.00–1.10, P ≤0.02, S ≤0.02, Cr 1.10–1.20, Mo 0.20–0.25 (mass %).
The Problem: An Invisible Process Variable
Laser quenching works because the laser drives the surface above the austenitizing temperature in a fraction of a second, after which the cold bulk self-quenches the layer into martensite. Whether that transformation actually occurs depends on the peak temperature the surface reaches — too low and nothing transforms, too high and the layer overheats or melts. But the peak is transient and unmeasurable by conventional instruments, which is why parameter selection historically drifted toward trial-and-error. The literature has long used simulation to fill the gap: international groups modelled laser hardening of shafts with ANSYS thermal analysis, and Chinese teams built three-dimensional solid models of surface temperature fields for laser-quenched steels. The 2021 study follows the same school but does something more useful: it couples simulation and experiment so that every predicted temperature field is checked against a measured microstructure and a wear result.
Building the Thermal Model
The model is straightforward and industrial. A three-dimensional axisymmetric specimen of 20 mm × 25 mm × 200 mm is meshed finely, the initial temperature is set to 20 °C room temperature, and the laser energy input uses the classical Gaussian heat source. The thermal properties of 4145H — density, specific heat capacity and thermal conductivity as functions of temperature — are fed from measured data:
| Temperature (°C) | Density (kg/m³) | Specific heat capacity (J·kg⁻¹·°C⁻¹) | Thermal conductivity (W·m⁻¹·°C⁻¹) |
|---|---|---|---|
| 20 | 7874 | 490 | 46.3 |
| 200 | 7874 | 502 | 48.0 |
| 500 | 7874 | 520 | 53.9 |
| 1000 | 7874 | 548 | 68.1 |
| 1500 | 7874 | 580 | 98.17 |
| 2000 | 7874 | 620 | 120 |
The model output is a transient temperature field for every parameter combination, and this single map explains the entire microstructure story of the experiments. Temperature is the master variable: the paper shows that different laser parameters change the surface temperature field, which changes the microstructure of the hardened layer, which changes the mechanical properties. Simulation and experiment agree within the study — the modelled field is validated by the measured microstructure at every point.
What the Simulation Reveals About Speed
At fixed power, surface temperature falls as scan speed rises, because a faster beam shortens the radiation and heat-transfer time at each point. At 100 and 200 mm/min the simulated surface temperature exceeds the 1600 °C melting threshold adopted in the study; the layer overheats, the self-cooling margin disappears, and the structure stays blocky ferrite plus pearlite — no martensite, low hardness, severe wear with a cracked oxide layer. At 300 mm/min the surface sits slightly above the melting threshold and the structure becomes granular bainite. At 400 mm/min the surface peaks just below melting; the dwell is long enough, the laser absorptivity is high, the self-cooling is sufficient, and fine acicular martensite forms — the peak of the whole matrix. At 600 and 800 mm/min the radiation time is too short, heat transfer is insufficient, transformation is starved, and the structure degenerates to lath martensite and then lamellar pearlite with blocky ferrite.
| Speed (mm/min) | Temperature regime (vs 1600 °C melting) | Resulting structure |
|---|---|---|
| 100–200 | Above melting, overheated | Blocky ferrite + pearlite |
| 300 | Slightly above melting | Granular bainite + retained austenite |
| 400 | Just below melting (optimum) | Fine acicular martensite |
| 600 | Below transformation window | Lath martensite + retained austenite |
| 800 | Insufficient heat | Lamellar pearlite + blocky ferrite |
What the Simulation Reveals About Power
At fixed speed, surface temperature rises with power because the surface absorbs more laser energy. At 400 mm/min the modelled peak temperatures are telling: 1.5 kW gives about 1300 °C, 1.8 kW about 1450 °C, 2.0 kW about 1550 °C — just below melting — and 2.2 kW pushes past 1600 °C. The microstructure tracks the field exactly: flaky martensite at 1.5 kW, coarse lath martensite at 1.8 kW, fine acicular martensite at 2.0 kW, and coarse lath martensite again at 2.2 kW when the surface overheats. The wear surfaces confirm it: 2 kW leaves only slight scratches and fine adhered debris, while 2.2 kW produces deep grooves and spall pits. The conclusion the simulation makes visible is that 2 kW is not the top of the range — it is the ceiling of the golden window, and going beyond it is overheating, not hardening.
| Power (kW) | Simulated surface temperature | Resulting structure |
|---|---|---|
| 1.5 | ~1300 °C | Flaky martensite |
| 1.8 | ~1450 °C | Coarse lath martensite |
| 2.0 | ~1550 °C, just below melting | Fine acicular martensite |
| 2.2 | Above 1600 °C melting | Coarse lath martensite |
Why Simulation-First Wins for Drill Tools
Drill tools are long, slender, expensive, and their surfaces cannot be instrumented mid-pass. Trial-and-error on a production drill collar is slow and costly; trial-and-error in a finite element model is cheap and repeatable. The 2021 study demonstrates the full loop: simulate the temperature field, identify the regime, run the experiment, verify the microstructure and wear. The optimum at 2 kW and 400 mm/min is not a lucky point — it is the parameter set whose simulated surface peak of about 1550 °C sits just below the 1600 °C melting threshold, where transformation is complete without overheating.
Laser quenching is sold as a black box with one dial and one result. The temperature field says otherwise: every kilowatt and every mm/min is a thermal decision, and the difference between a 55 HRC case and a melted, pearlitic surface is a few hundred degrees that no one can see with the naked eye. Simulation-first design is not a research luxury — it is how you find the window before you touch a production part, and how you defend it when a customer asks why your parameters differ from the brochure.
Practical Rules for Process Owners
- Model first, then cut coupons: run the transient thermal simulation for your exact spot size and grade before burning production parts.
- Target the temperature field, not the machine display: for 4145H at a φ10 mm spot, aim for a surface peak just below the 1600 °C melting threshold — the study’s optimum sits at 2 kW and 400 mm/min.
- Never transplant parameters across grades or beam sizes: 42CrMo4, JIS SCM440 and 4145H harden on different thermal windows even though they look alike on a chemistry sheet.
- Validate the model with microstructure: the simulation is only as trustworthy as the martensite map it predicts; require both the temperature field and the metallography in every process report.
The Bottom Line
The unmeasurable is no longer unknowable. The 2021 study proves that an ANSYS transient thermal model of the 4145H laser quench predicts the microstructure, hardness and wear outcome of every parameter combination, and that the golden window — 2 kW, 400 mm/min, φ10 mm spot, surface peak just below melting — is a thermal fact, not an empirical accident. SHUNFU METAL supplies 4145H drill-collar stock and applies the same temperature-field logic when validating surface treatment windows, because a window proven in the model is a window that will survive in the hole.