By Harris, Technical Team, SHUNFU METAL
One Grade, Four Standard Systems
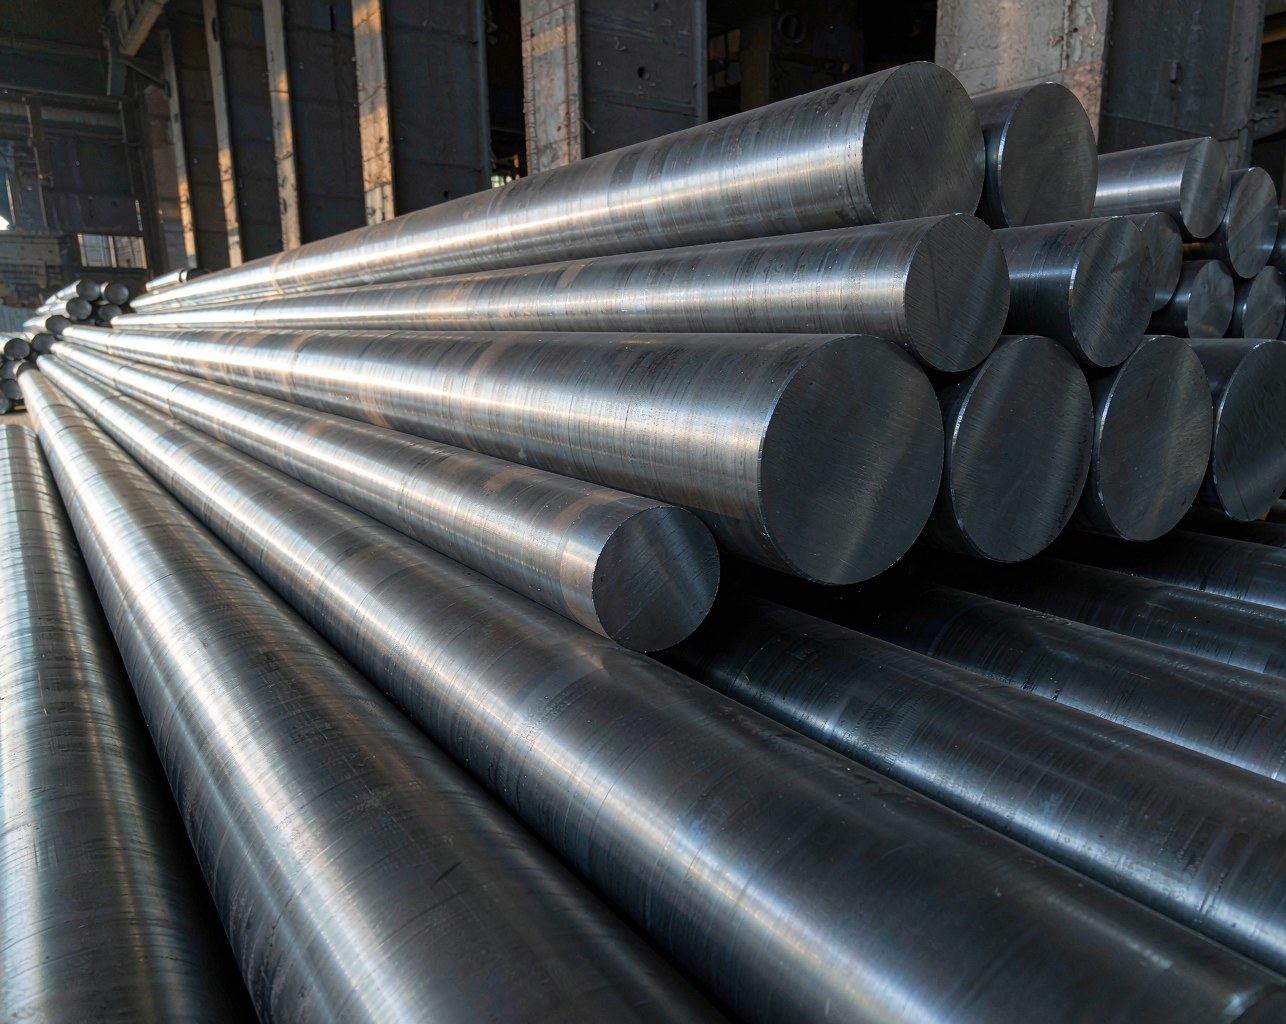
AISI 4140 is the world’s most widely specified chromium-molybdenum alloy steel, but the same steel carries different names in different markets: EN 42CrMo4 (1.7225) in Europe, JIS SCM440 in Japan, BS 708M40 in Britain, GOST 40KhM in Russia, and 42CrMo under the Chinese standard GB/T 3077. In offshore engineering the grade is best known as the material of high-strength bolts, typically supplied in quenched and tempered (QT) condition as a 10.9 grade. This article summarizes a 2024 master’s study from Yanshan University on the corrosion and fatigue behavior of 4140 in marine environments, cross-checked against published international work on the same grade.
| Standard system | Designation |
|---|---|
| AISI / SAE, USA | 4140 (UNS G41400) |
| EN 10083-3, Europe | 42CrMo4 (1.7225) |
| DIN, Germany | 42CrMo4 / 1.7225 |
| JIS G4053, Japan | SCM440 |
| BS, United Kingdom | 708M40 |
| GOST, Russia | 40KhM |
| GB/T 3077, China | 42CrMo |
The Hidden Threat: Pitting, Not Thinning
A bolt in a marine atmosphere loses thickness slowly; in seawater immersion the study measured a stable corrosion rate of only about 0.5 mm per year. On paper that sounds acceptable for a 20-year design life. That is the false sense of security. The real killer is localized pitting: corrosion pits act as micro-notches on the surface, concentrating stress and turning a smooth bolt into a precracked one under alternating load. In the salt spray test simulating the atmospheric and splash zones, the peak corrosion rate reached 3.6 mm per year after only 8 hours of exposure, with corrosion starting as spherical clusters and later developing into layered rust. Uniform thinning is an accounting problem; pitting is a fatigue problem.
Corrosion in Two Marine Environments
The study simulated three service zones, grouped into two environments: salt spray (marine atmosphere and splash zone, wet-dry cycling) and full seawater immersion. The difference in kinetics is striking. Salt spray corrosion follows a power-law mass loss, M equals 0.88 times t to the power 0.59, reflecting accelerating attack under wet-dry cycling; seawater immersion follows a linear law, M equals 0.04t plus 0.13, with a stable rate. Dry-wet alternation, not chloride concentration alone, is what drives the splash zone so hard.
| Parameter | Salt spray (atmosphere / splash) | Seawater immersion (full) |
|---|---|---|
| Corrosion rate | Peak 3.6 mm/a at 8 h | Stable, about 0.5 mm/a |
| Mass loss law (mg/cm²) | M = 0.88·t0.59 (power) | M = 0.04t + 0.13 (linear) |
| Roughness vs time (μm) | Ra = 0.043t + 1.43 | Ra = 0.0089t + 0.317 |
| Max pit depth vs time (μm) | D = 0.30t + 12.6 | D = 0.11t + 2.91 |
| Rust morphology | Spherical clusters, then layered | Cotton-like, needle, strip |
What the Rust Is Made Of
In both environments the corrosion products were identified by SEM and EDS as five oxides. The key finding is the role of β-FeOOH (akaganeite): it needs chloride ions built into its crystal structure for support, which is why it is the critical phase in seawater-type corrosion. Oxygen is the driving agent for 4140 corrosion, while chloride activates and accelerates pitting. The message for offshore buyers: a rust layer is not a passive film, and the chloride-bearing phase is a reservoir for continued attack.
| Phase | Significance |
|---|---|
| γ-FeOOH (lepidocrocite) | Early-stage rust phase |
| β-FeOOH (akaganeite) | Requires Cl¹ in its structure; key seawater phase |
| α-FeOOH (goethite) | Stable, protective end product |
| Fe3O4 (magnetite) | Inner dense layer |
| Fe2O3 (hematite) | Oxide in the outer scale |
Roughness and Pit Depth Grow Linearly with Time
After rust removal, both surface roughness and maximum pit depth increased linearly with corrosion time, in both environments. In salt spray, Ra (arithmetic mean roughness) follows Ra = 0.043t + 1.43 and pit depth follows D = 0.30t + 12.6; in immersion the slopes are far gentler, 0.0089 and 0.11. The practical value of linear laws is predictability: surface damage in the splash zone can be estimated from exposure time alone, which makes inspection scheduling and life prediction possible without taking a bolt out of service.
Fatigue Life: A Linear Price for Every Micron
The headline result is brutally simple: fatigue life falls linearly with surface roughness, Nf = 168,030 − 11,970 × Ra(μm). Every additional micron of roughness costs roughly 11,970 cycles, about 7 percent of the baseline life of a fresh specimen. The mechanism is geometric: deeper corrosion pits mean more crack-initiation sites, and multiple cracks merging accelerate final fracture. Fractography showed the classic three zones, fatigue source, crack propagation and final fracture, with fan-shaped or semicircular sources and river patterns, tear ridges, cleavage steps and secondary cracks, but no fatigue striations, because 4140 is BCC with high stacking-fault energy and easy cross-slip. The identical equation was reproduced in the published journal version of this work on offshore wind turbine bolts, confirming its robustness.
Pits Are Micro-Notches
Using reverse engineering, roughly 360,000 three-dimensional data points of a real corroded surface were reconstructed and analyzed by FEA. The Kt (theoretical stress concentration factor) rose from 1.25 after 24 hours of salt spray to 2.27 after 240 hours, and the maximum stress always sat at the deepest pit. The quantitative link is Kt = 0.99 + 0.016D(μm). A pit of 80 μm depth almost doubles the local stress; the bolt does not need a crack to be damaged, the pit is the crack in waiting.
| Salt spray time | Pit width (mm) | Pit depth (μm) | Kt max | KI max (MPa·mm1/2) |
|---|---|---|---|---|
| 24 h | 0.26 | 15.6 | 1.25 | 204.5 |
| 48 h | 0.25 | 29.6 | 1.42 | 281.8 |
| 96 h | 0.58 | 42.2 | 1.70 | 355.2 |
| 168 h | 0.64 | 67 | 1.97 | 431.3 |
| 240 h | 0.82 | 81 | 2.27 | 478 |
Stress Intensity Factor at the Pit Bottom
Treating each pit as a semi-elliptical crack under a 910 MPa load, the KI (mode I stress intensity factor) at the pit bottom grew from 204.5 to 478 MPa·mm1/2 as corrosion advanced from 24 to 240 hours, while pit width grew from 0.26 to 0.82 mm and depth from 15.6 to 81 μm. The maximum KI doubled, and the pit size, not the mass loss, is the damage index that controls the remaining life. This mirrors international work on 42CrMo pre-corroded specimens, where corrosion pit size was likewise established as the governing parameter for residual fatigue life prediction via the Paris law, da/dN = C(ΔK)n. For the 240 h condition the threshold ΔKth (fatigue crack growth threshold) was 218.78 MPa·mm1/2 at a stress ratio of 0.3.
The Blind Spot: Pre-Corrosion vs True Corrosion Fatigue
One limitation deserves attention: like most published studies, this work corroded specimens first and fatigued them afterward, a separated pre-corrosion fatigue test. The author states plainly that corrosion and fatigue should ideally act simultaneously in future work. In a real splash zone, pitting and cyclic loading interact continuously, chloride accelerates crack tip damage, and the true life is likely shorter than the separated test suggests. When engineers convert these equations into inspection intervals or design margins, a generous safety factor is not conservative, it is realism.
What Buyers Should Take Away
Four conclusions matter for anyone sourcing 4140/42CrMo4 bolts or bars for offshore service. First, surface quality is life budget: every micron of roughness costs roughly 12,000 fatigue cycles, so mill surface finish and handling protection during transport are not cosmetic issues. Second, protection is a system: coatings fail at edges and scratches, and once the chloride-bearing rust phase forms, attack continues underneath, so inspection must target pits, not visible rust thickness. Third, crack initiation consumes about 63 percent of the fatigue life, meaning by the time a crack is detectable, most of the bolt’s life is already gone; pit depth measurement is an earlier and better warning signal. Fourth, the grade itself is sound; the failure mode is environmental, and specifying tighter internal chemistry, cleaner steel and consistent QT response is what separates a marine-grade supply from a commodity one.