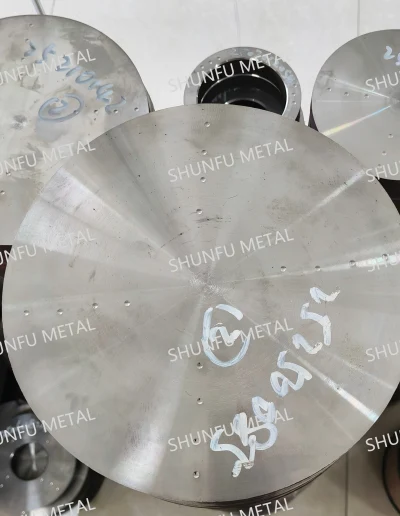
A forged shaft produced by the company, made of 42CrMo steel with a net weight of 15 tons and using a 24-ton steel ingot, underwent the following production process:
Vacuum smelting → casting → forging → post-forging heat treatment → rough machining → ultrasonic testing → quenching and tempering → semi-finish machining → ultrasonic testing → finish machining → magnetic particle testing → dimensional and visual inspection → marking, packaging, and shipping.
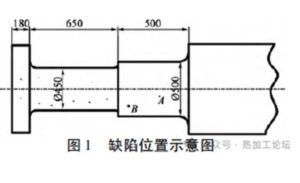
During non-destructive testing conducted after rough machining, defects exceeding the acceptable limits were detected. The location of the defect is shown in Figure 1.
Forged Shaft
Scattered Defects Found Within 1630 mm from the Ingate Face
Multiple scattered defects were detected within a 1630 mm length range from the ingate end face, with defect depths ranging from 210 mm to 450 mm.
- At Point A, located 235 mm along the axis from a diameter of Φ570 mm, a defect was found at a depth of 346 mm with an equivalent diameter of Φ4.5 mm, which exceeds the acceptable limit.
- At Point B, 45 mm along the axis from Φ570 mm, a defect at a depth of 242 mm had an equivalent diameter of Φ5.5 mm.
- All other defects had an equivalent diameter of ≤ Φ2 mm.
The part was evaluated as non-conforming and deemed scrapped.
To understand the nature of the defects, strengthen process control, and improve product quality, various methods—low magnification, metallography, scanning electron microscopy, and energy-dispersive spectroscopy (EDS)—were used to analyze the defect areas.
Inspection Results
To investigate the causes of the defects, ultrasonic testing was first used to identify the areas with the most severe defects, which were then marked. A 35 mm thick transverse specimen (specimen A) was cut from the marked location for further analysis.
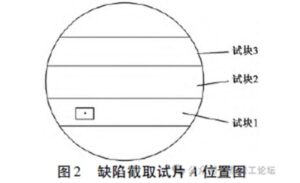
On specimen A, a 2 mm × 3 mm elliptical hole was observed with the naked eye. It exhibited a different color compared to the base material, had an irregular shape, distinct edges, and showed characteristics typical of foreign metal inclusions under low magnification. The defect was located in the boxed area of Test Block 1, as shown in Figure 2.
Based on the distribution of defects, test blocks 1, 2, and 3 were sampled as shown in Figure 2 and analyzed accordingly. After dye penetrant inspection, no defects were found in test blocks 2 and 3.
Transverse Specimen
2 EDS (Energy-Dispersive Spectroscopy) Analysis
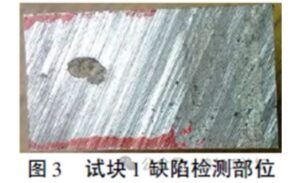
EDS analysis was conducted on the defect area of Test Block 1. The specific inspection location of Test Block 1 is shown in Figure 3.
Energy-Dispersive Spectroscopy Image
EDS Analysis of Minor Defect Areas in Test Block 1
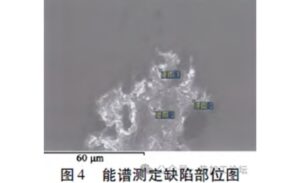
An EDS (Energy-Dispersive Spectroscopy) analysis was performed on smaller defect areas within Test Block 1.
- Figure 4 shows the locations on Test Block 1 where EDS measurements were taken.
- Figure 5 presents the EDS spectra from the three measurement points.
- Table 1 lists the atomic percentages of each element detected at the EDS measurement points on Test Block 1.
EDS measurements location on Test Block 1
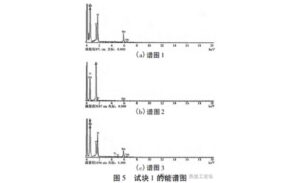
EDS Spectra
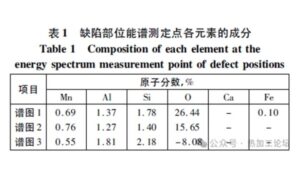
Atomic Percentages List
From the EDS analysis of Test Block 1, it can be seen that the main components of the prominent inclusion are Mn (manganese), Al (aluminum), Si (silicon), and O (oxygen).
To trace the source of the inclusions, EDS analysis was also performed on the refractory materials in the central pouring pipe and runner.
- Figure 6 shows the EDS spectra of the four measurement points.
- Table 2 presents the elemental and compound compositions detected at those measurement points on the refractory materials.
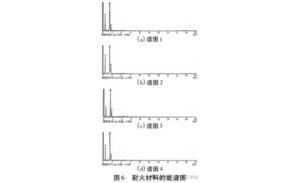
EDS spectra
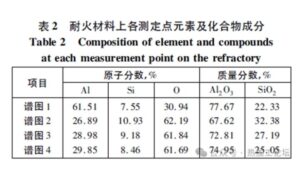
Elemental and compound compositions Table
From the EDS analysis of the refractory materials in the central pouring pipe and runner, it was found that the main components are Al, Si, and O, primarily existing in the form of Al₂O₃ (aluminum oxide) and SiO₂ (silicon dioxide).
Scanning Electron Microscope (SEM) Analysis
Alongside the EDS analysis, a scanning electron microscope (SEM) analysis was conducted on the cavity in Test Block 1.
- Figure 7 shows the SEM images of Test Block 1.
- From Figures 7(a) and 7(c), it can be observed that the inclusions in Test Block 1 exhibit a stone-like morphology in localized areas.
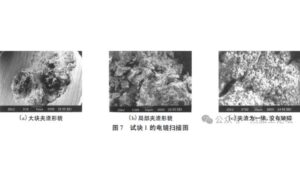
stone-like morphology
4 Chemical Composition Analysis
- Spectral analysis was carried out around the cavity defect in Test Block 1.
- The surface area analyzed by spectroscopy is shown in Figure 8
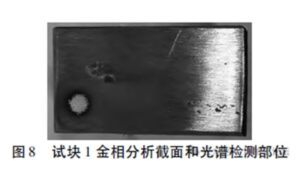
Spectral Analysis
As shown in Table 3, the chemical composition of Test Block 1 meets all acceptance requirements, with no abnormalities detected
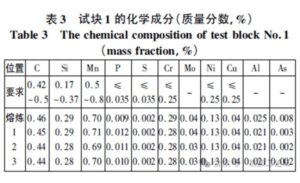
Chemical Composition Table
5 Metallographic Analysis
Metallographic analysis was performed around the cavity defect in Test Block 1.
- The metallographic inspection surface is shown in Figure 9.
- The microstructure image of the metallic inclusion is shown in Figure 10.
- The grain structure image is shown in Figure 11.
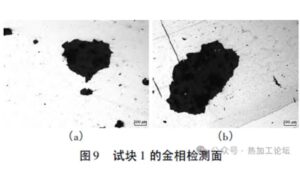
Metallographic inspection surface
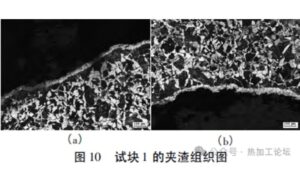
Microstructure image of the metallic inclusion
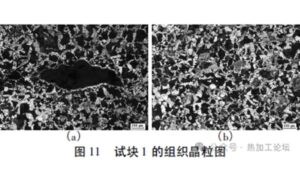
Grain structure image
Due to the large size of the inclusion in Test Block 1, which far exceeds the levels shown in the standard rating charts, it was not possible to determine the exact grade of the inclusion types. However, the microstructure and grain size around the defect area in Test Block 1 were found to be good. The microstructure consists of ferrite and pearlite, and the grain size is rated as Grade 6.0.
Cause Analysis
The main characteristics of endogenous and exogenous inclusions are as follows:
- Endogenous inclusions are typically outstanding (also known as fine inclusions), numerous, and evenly distributed throughout the steel ingot. Their composition is closely related to that of the molten steel.
- Exogenous inclusions, on the other hand, are usually larger (also known as coarse inclusions), irregular in shape, randomly distributed, and sporadic in occurrence. Their composition and structure are complex and are not directly related to the molten steel composition.
However, in actual steelmaking processes, endogenous and exogenous inclusions often coexist. This occurs because:
- Throughout different stages of steelmaking, endogenous inclusions commonly precipitate around exogenous inclusions, often undergoing interactions—a widespread phenomenon.
- When deoxidized molten steel comes into contact with entrained slag (including protective slag) or refractory materials, chemical reactions often occur to varying degrees. As a result, it is uncommon for inclusions to retain their original endogenous or exogenous composition or structure.
In the case of Test Block 1, the large size of the inclusion suggests that endogenous inclusions are not the primary cause. The most likely reason is exogenous inclusions.
Based on the company’s actual production process, the primary sources of exogenous inclusions include:
- Steel slag
- Protective slag
- Ladle refractory lining
- Refractory materials in the central pouring pipe and runner
Currently, the ladle refractory lining mainly uses magnesia-carbon bricks. However, EDS analysis showed no Mg (magnesium) content in the inclusions, making it unlikely that the inclusion originated from the magnesia-carbon bricks.
Although steel slag and protective slag contain high levels of Ca (calcium), the main elements detected in the EDS analysis of Test Block 1 did not include Ca, suggesting that slag is also unlikely to be the source of the inclusion.
The refractory materials used in the runner bricks and central pouring pipe are primarily sintered mullite. The chemical composition of sintered mullite is provided in Table 4.
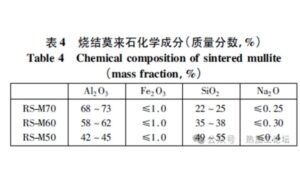
Chemical composition of sintered mullite
As shown in Table 4, the main components of mullite are Al, Si, and O elements. Additionally, from the EDS analysis of the refractory materials in the central pouring pipe and runner, it is evident that these materials are primarily composed of Al, Si, and O, mainly in the form of Al₂O₃ and SiO₂, which aligns with the typical composition of mullite. The EDS results for Test Block 1 revealed Mn, Al, Si, and O as the primary elements.
This indicates that, aside from Mn, the other elements closely match the composition of the refractory materials.
Possible Sources of Mn in the Inclusion:
- During pouring, once exogenous inclusions enter the molten steel, chemical reactions may occur between the inclusions and the steel, causing compositional changes and allowing Mn from the steel to enter the inclusions.
- The exogenous inclusions may contain a high level of alumina (Al₂O₃), which could adsorb Mn from the molten steel. Additionally, since the sulfur (S) content in this heat of steel is very low, Mn + S clusters could not form and detach from the inclusions, resulting in Mn remaining within the inclusions.
Pouring Process and Defect Formation:
This steel ingot was cast using a bottom-pouring method, where molten steel flows from the central pouring pipe into the runner and then into the ingot mold. If the refractory materials in the central pipe and runner have quality issues, they may gradually erode during the pouring process. As pouring continues, the erosion becomes more severe, possibly causing localized spalling of the refractory materials, which are then carried by the steel flow into the ingot mold.
Since this typically occurs in the later stages of pouring, the detached refractory fragments may not have enough time to float to the surface before the steel begins to solidify. This results in the inclusions being trapped near the core of the ingot, close to the ingate end, forming cavity-type slag inclusions.
Conclusion
To prevent the recurrence of such defects, the following measures are recommended:
- Establish and strictly implement a comprehensive system for managing and accepting refractory materials. Reinforce inspection procedures and improve process quality to prevent the generation of exogenous inclusions.
- Ensure strict adherence to the forging process, particularly discarding the ingate-end material as required, to prevent defects at the ingate end of the ingot from remaining in the final forged body.